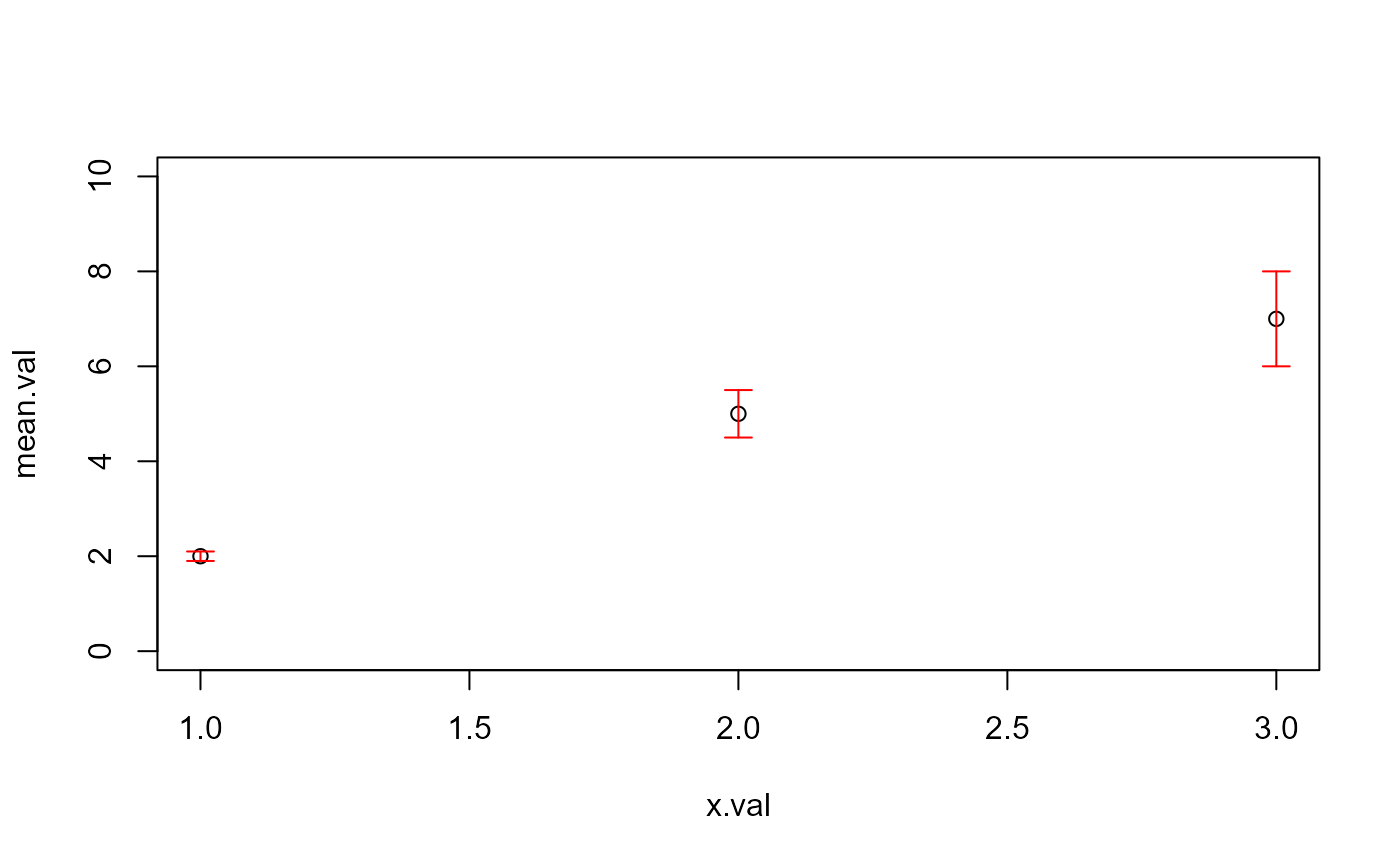
Errorbars to be used with base plotting
errorbars(x, Mean, SE, col, lty = 1, length = 0.07, lwd = 1)Arguments
- x
x value
- Mean
mean value or y alternative
- SE
standard error
- col
color of bars
- lty
Line type The line type. Line types can either be specified as an integer (0=blank, 1=solid (default), 2=dashed, 3=dotted, 4=dotdash, 5=longdash, 6=twodash) or as one of the character strings "blank", "solid", "dashed", "dotted", "dotdash", "longdash", or "twodash", where "blank" uses ‘invisible lines’ (i.e., does not draw them).
- length
length of the edges of the error bar head (in inches).
- lwd
line width
Value
draws lines in the form of error bars
Note
see arrows() function