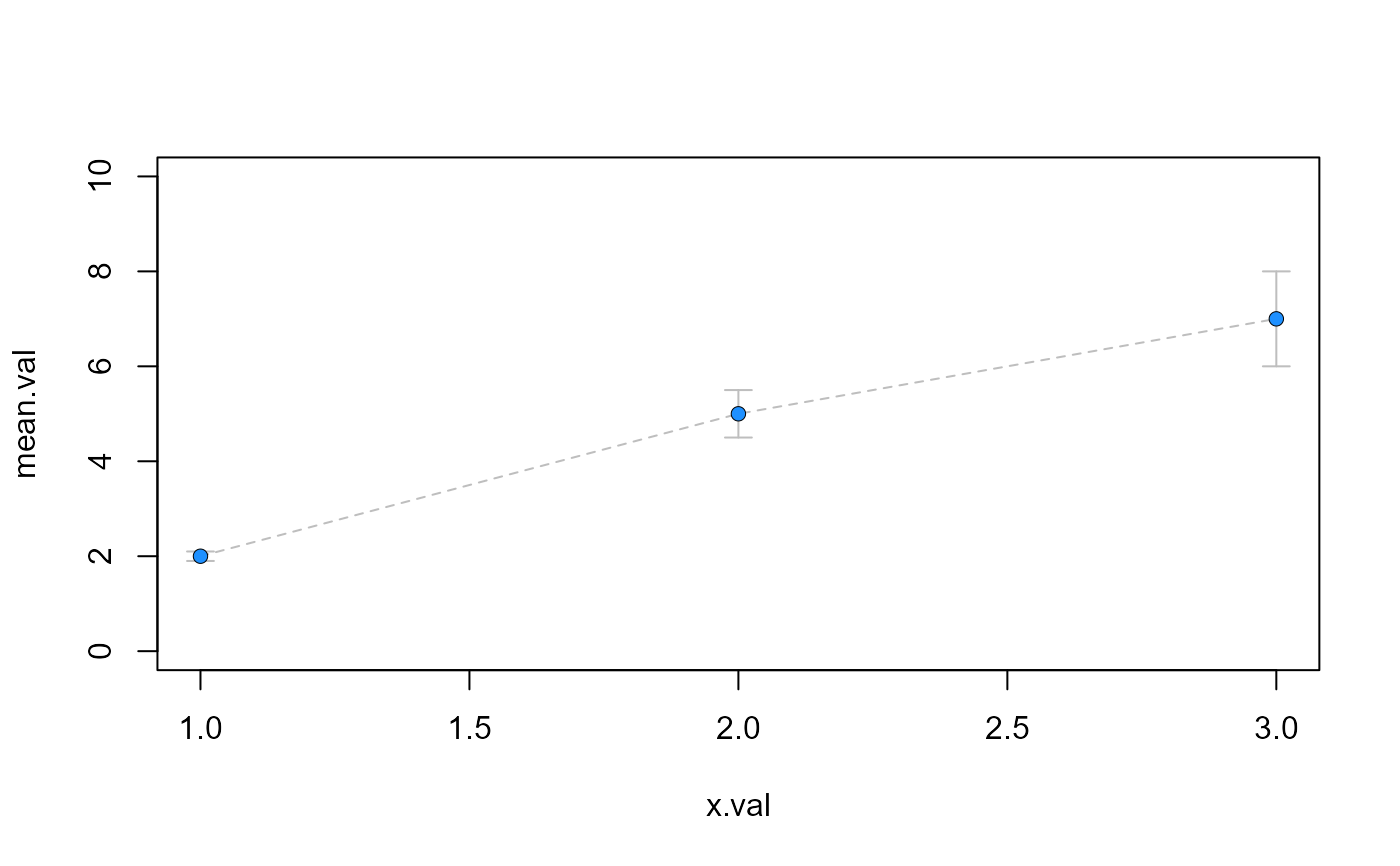
Point with error bars
pt_line_error(
  x,
  y,
  SE,
  ln.lty,
  ln.col,
  ln.lwd,
  pch,
  bg,
  cex = 1,
  pt.lwd = 1,
  pt.lty = 1,
  er.lwd = 1,
  pt.col = "black",
  length = 0.07
)
Arguments
- x
x-value
- y
y-value (or mean)
- SE
standard error
- ln.lty
line type
- ln.col
color of lines
- ln.lwd
width of lines
- pch
plotting ‘character’, i.e., symbol to use. see points()
- bg
background (fill) color for the open plot symbols given by pch = 21:25. see points()
- cex
size of point
- pt.lwd
line width of points
- pt.lty
line type for points
- er.lwd
error bar line width
- pt.col
color of point
- length
length of the edges of the error bar head (in inches).
Value
draws lines in the form of error bars
Note
see arrows(), errorbars() and pt_error() functions