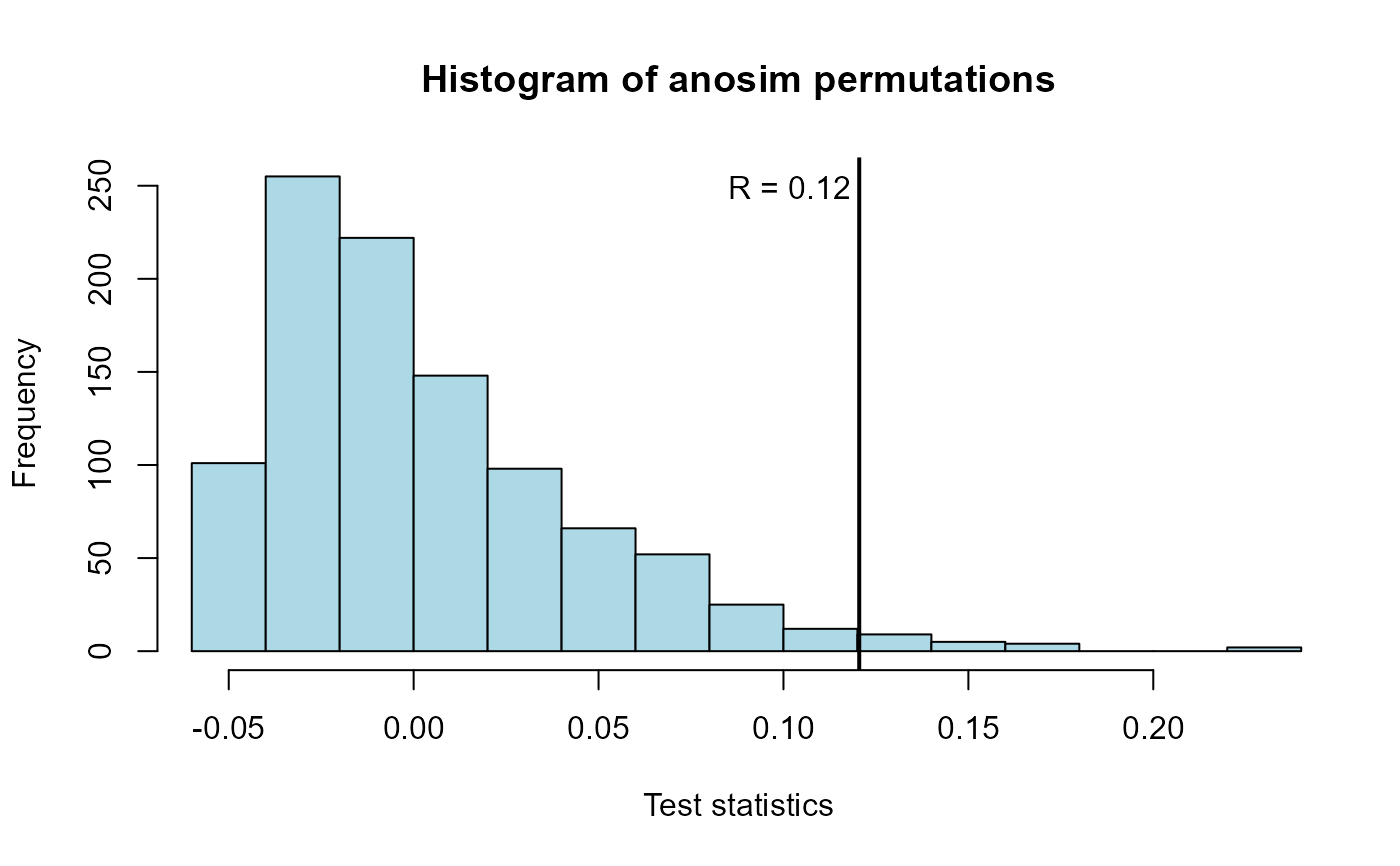
Plots the permutation histogram and test statistic produced by an anosim (nonparametric multivariate) test of differences between groups.
anosimPlot(
  ano.out,
  hcol = "light blue",
  title = "Histogram of anosim permutations"
)
Arguments
- ano.out
an
anosimobject. See details and example- hcol
color of histogram
- title
title of histogram
Value
Plots a histogram of the permutation test statistics representing the null hypothesis along with the observed test statistic from the data. The p-value is the proportion of test statistics equal to or more extreme than the observed test statistic.
References
Helsel, D.R., 2011. Statistics for Censored Environmental Data using Minitab and R, 2nd ed. John Wiley & Sons, USA, N.J.
Oksanen, J., Guillaume, F., 2018. Vegan: ecological diversity. CRAN R-Project. https://cran.r-project.org/package=vegan
See also
Examples
data(PbHeron)

# ROS model for each group
PbHeron.high <- with(subset(PbHeron,DosageGroup=="High"),ros(Blood,BloodCen))
PbHeron.high <- data.frame(PbHeron.high)
PbHeron.high$DosageGroup <- "High"

PbHeron.low <- with(subset(PbHeron,DosageGroup=="Low"),ros(Blood,BloodCen))
#> Warning: More than 80% of data is censored.
PbHeron.low <- data.frame(PbHeron.low)
PbHeron.low$DosageGroup <- "Low"

PbHeron.ros=rbind(PbHeron.high,PbHeron.low)

# ANOSIM analysis
library(vegan)
#> Warning: package 'vegan' was built under R version 4.1.3
#> Loading required package: permute
#> Warning: package 'permute' was built under R version 4.1.3
#> Loading required package: lattice
#> This is vegan 2.6-4
#>
#> Attaching package: 'vegan'
#> The following object is masked from 'package:EnvStats':
#>
#>     calibrate
PbHeron.anosim <- with(PbHeron.ros,anosim(modeled,DosageGroup))
summary(PbHeron.anosim)
#>
#> Call:
#> anosim(x = modeled, grouping = DosageGroup)
#> Dissimilarity: bray
#>
#> ANOSIM statistic R: 0.1205
#>       Significance: 0.02
#>
#> Permutation: free
#> Number of permutations: 999
#>
#> Upper quantiles of permutations (null model):
#>    90%    95%  97.5%    99%
#> 0.0556 0.0863 0.1090 0.1428
#>
#> Dissimilarity ranks between and within classes:
#>         0%    25%   50%    75% 100%   N
#> Between  1  99.25 198.5 275.75  348 182
#> High     4 173.50 252.5 299.50  351  78
#> Low      8  60.00 108.0 160.50  242  91
#>

# Plot
anosimPlot(PbHeron.anosim)