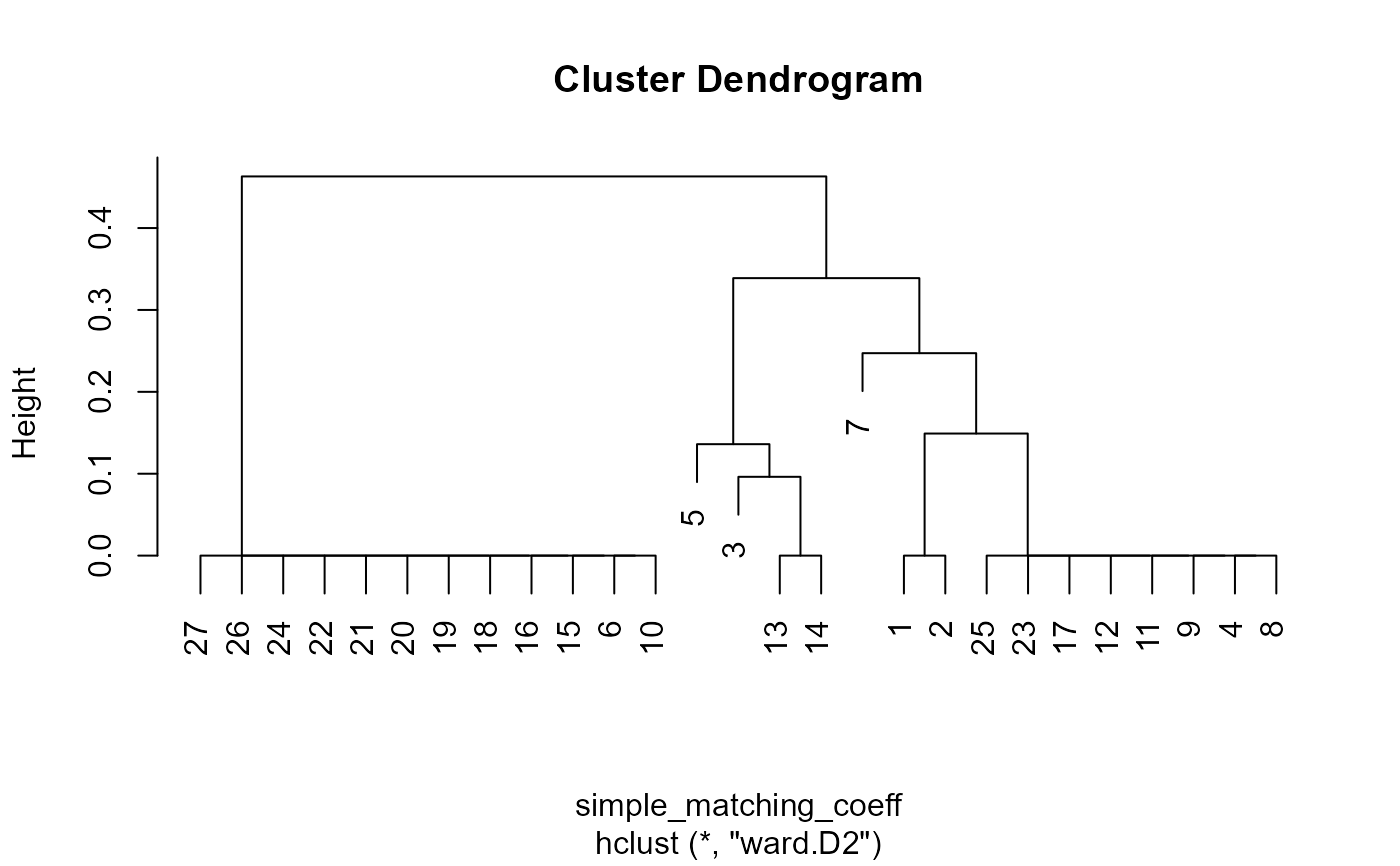
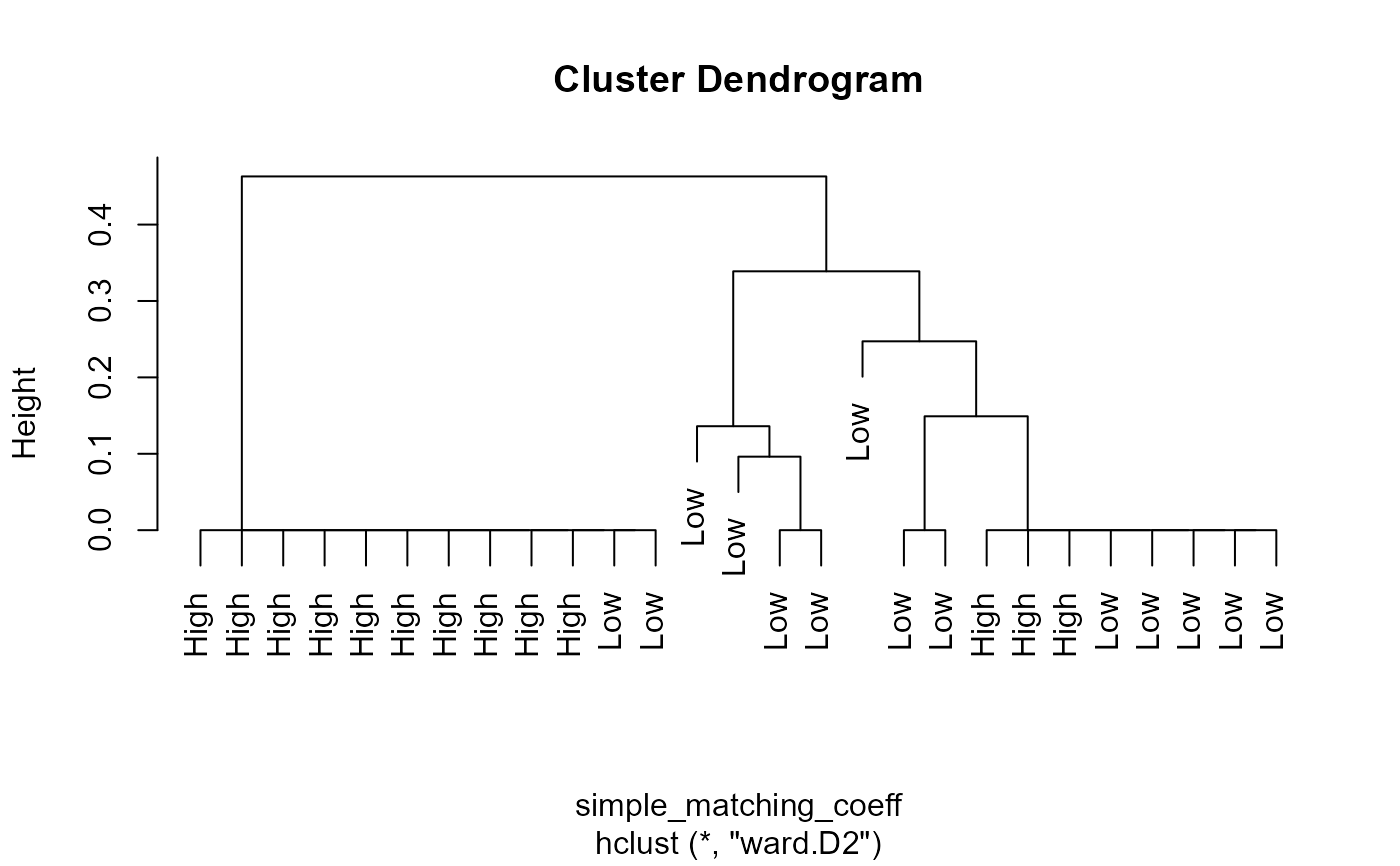
Performs clustering of a matrix of 0s and 1s, ie. the censoring indicator columns for multiple variables. If there are multiple detection limits within a column first convert the 0/1 designated to be Below vs Above the highest detection limit in the column. Detection limits may differ among columns.
binaryClust(
  data,
  method = "ward.D2",
  group = NULL,
  ncluster = NULL,
  plotncluster = TRUE,
  clustIndex = "all"
)
Arguments
- data
A data frame containing only the 0/1 columns, one column per chemical parameter.
- method
Method of forming clusters. The default is
"ward.D2", which is appropriate for a variety of types of data. Another appropriate option is“average”– average distances between cluster centers. See the vegan package for other possible clustering methods.- group
Optional grouping variable. If used, sites being clustered will be represented by their group name, rather than by the row number.
- ncluster
Optional number of clusters to be differentiated on the graph. Clusters are fenced off with rectangles.
- plotncluster
default is
TRUElogical flags to add identification of clusters on dendrogram- clustIndex
Optional, if not specified, potential number of clusters will be determined based on the mean best number of clusters across all indicies. For a specific index, see details
Value
Prints a cluster dendrogram based on clustering method and outputs a list of clusters and hierarchical cluster analysis results
Details
If a specific index is desired to determine the best number of clusters see NbClust::NbClust for index values.
References
Helsel, D.R., 2011. Statistics for Censored Environmental Data using Minitab and R, 2nd ed. John Wiley & Sons, USA, N.J.
Examples
data(PbHeron)

# without group specified
binaryClust(PbHeron[,4:15])
#> Warning: NaNs produced

#> $hclust
#>
#> Call:
#> hclust(d = simple_matching_coeff, method = method)
#>
#> Cluster method   : ward.D2
#> Distance         : simplematch
#> Number of objects: 27
#>
#>
#> $clusters
#>  [1] 1 1 2 1 2 3 4 1 1 3 1 1 2 2 3 3 1 3 3 3 3 3 1 3 1 3 3
#>

# With Group argument
binaryClust(PbHeron[,4:15],group=PbHeron$DosageGroup)
#> Warning: NaNs produced

#> $hclust
#>
#> Call:
#> hclust(d = simple_matching_coeff, method = method)
#>
#> Cluster method   : ward.D2
#> Distance         : simplematch
#> Number of objects: 27
#>
#>
#> $clusters
#>  [1] 1 1 2 1 2 3 4 1 1 3 1 1 2 2 3 3 1 3 3 3 3 3 1 3 1 3 3
#>