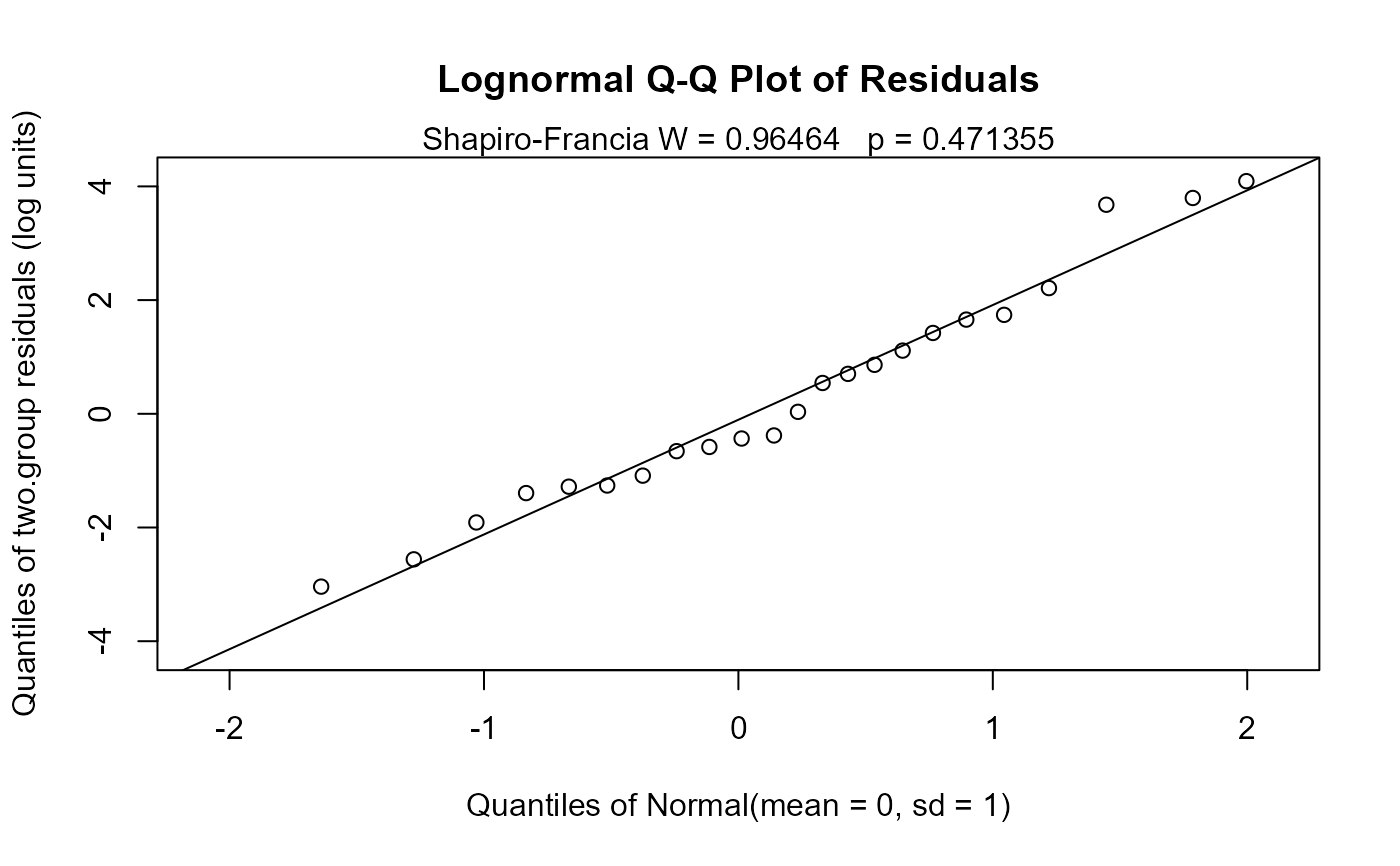
Performs a parametric test of differences in means between two groups of censored data, either in original or in log units (the latter becomes a test for difference in geometric means).
cen2means(x1, x2, group, LOG = TRUE, printstat = TRUE)Arguments
- x1
The column of data values plus detection limits
- x2
The column of indicators, where 1 (or
TRUE) indicates a detection limit in the y1 column, and 0 (orFALSE) indicates a detected value in y1.- group
Grouping or factor variable. Can be either a text or numeric value indicating the group assignment.
- LOG
Indicator of whether to compute tests in the original units, or on their logarithms. The default is to use the logarithms (LOG =
TRUE). To compute in original units, specify the option LOG =FALSE(or LOG = 0).- printstat
Logical
TRUE/FALSEoption of whether to print the resulting statistics in the console window, or not. Default isTRUE.
Value
Q-Q Plot with Shapiro-Francia test for normality W and p-values.
Returns the Maximum Likelihood Estimation (MLE) test results including Chi-Squared value, degrees of freedom and p-value of the test.
Details
Because this is an MLE procedure, when a normal distribution model is used (LOG=FALSE) values may be modeled as below zero. When this happens the means may be too low and the p-values may be unreal (often lower than they should be). Because of this, testing in log units is preferable and is the default.
References
Helsel, D.R., 2011. Statistics for Censored Environmental Data using Minitab and R, 2nd ed. John Wiley & Sons, USA, N.J.
Shapiro, S.S., Francia, R.S., 1972. An approximate analysis of variance test for normality. Journal of the American Statistical Association 67, 215–216.
Examples
data(PbHeron)
cen2means(PbHeron$Liver,PbHeron$LiverCen,PbHeron$DosageGroup)
#>      MLE 't-test' of mean natural logs of CensData: PbHeron$Liver by Factor: PbHeron$DosageGroup
#>      Assuming lognormal distribution of residuals around group geometric means
#>      geometric mean of High = 0.7762     geometric mean of Low = 0.05753
#>      Chisq = 9.696  on 1 degrees of freedom     p = 0.00185
#>
