Plots the empirical cdf and cdfs of three theoretical distributions, fit by maximum likelihood estimation (MLE).
cenCompareCdfs(x.var, cens.var, dist3 = "norm", Yname = yname)Arguments
- x.var
The column of y (response variable) values plus detection limits
- cens.var
The column of indicators, where 1 (or
TRUE) indicates a detection limit in they.varcolumn, and 0 (orFALSE) indicates a detected value iny.var.- dist3
Name of the third distribution to be plotted, default is
norm(normal distribution). Alternate third distribution isweibull(for Weibull distribution). Log-normal and gamma distributions are always used.- Yname
Optional – input text in quotes to be used as the variable name. The default is the name of the
y.varinput variable.
Value
prints a plot of the empirical CDFs with BIC value for each distribution.
References
Helsel, D.R., 2011. Statistics for Censored Environmental Data using Minitab and R, 2nd ed. John Wiley & Sons, USA, N.J.
Delignette-Muller, M., Dutang, C., 2015. fitdistrplus : An R Package for Fitting Distributions. Journal of Statistical Software, 64, 1-34. http://www.jstatsoft.org/v64/i04/.
Examples
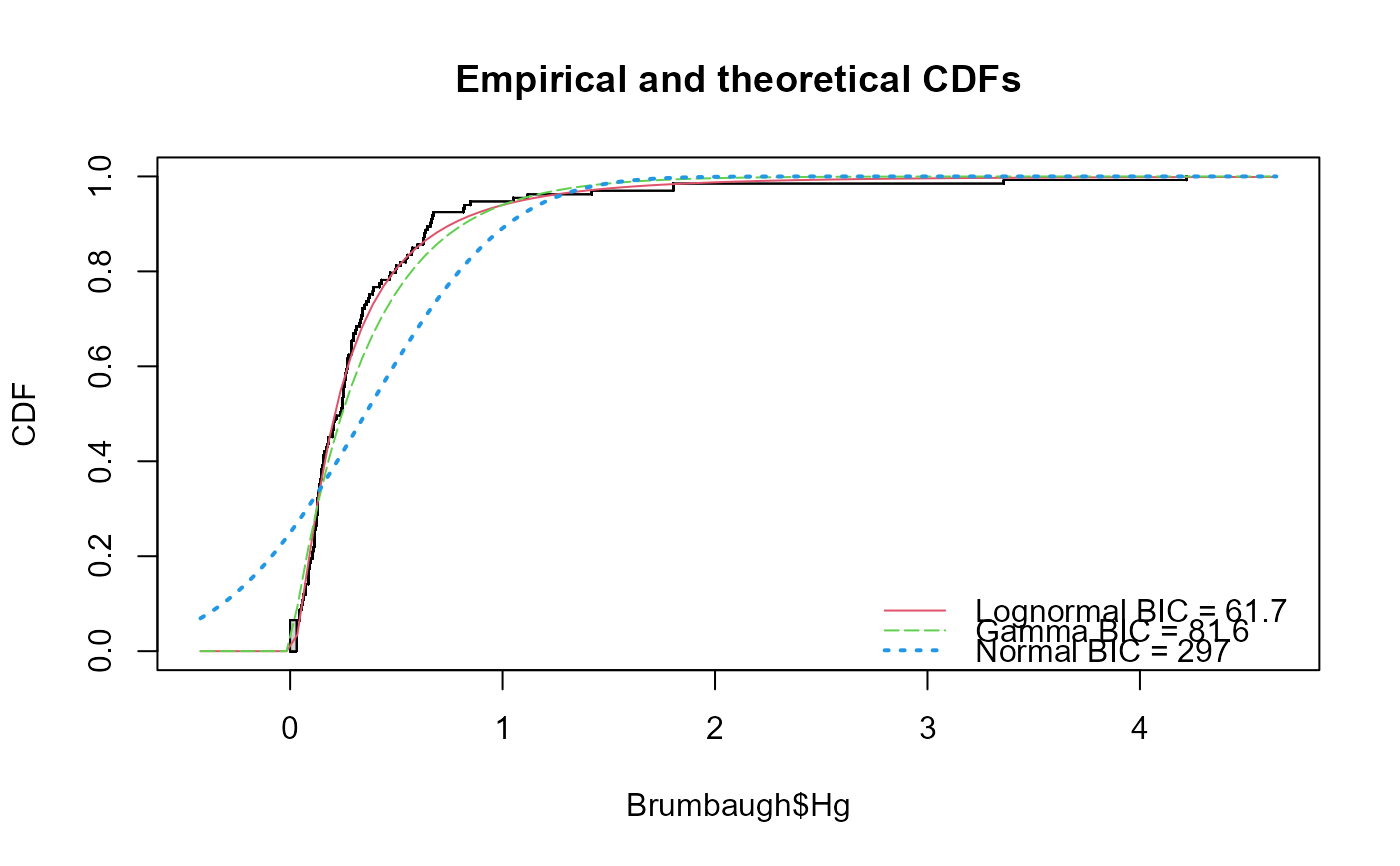
data(Brumbaugh)
cenCompareCdfs(Brumbaugh$Hg,Brumbaugh$HgCen)
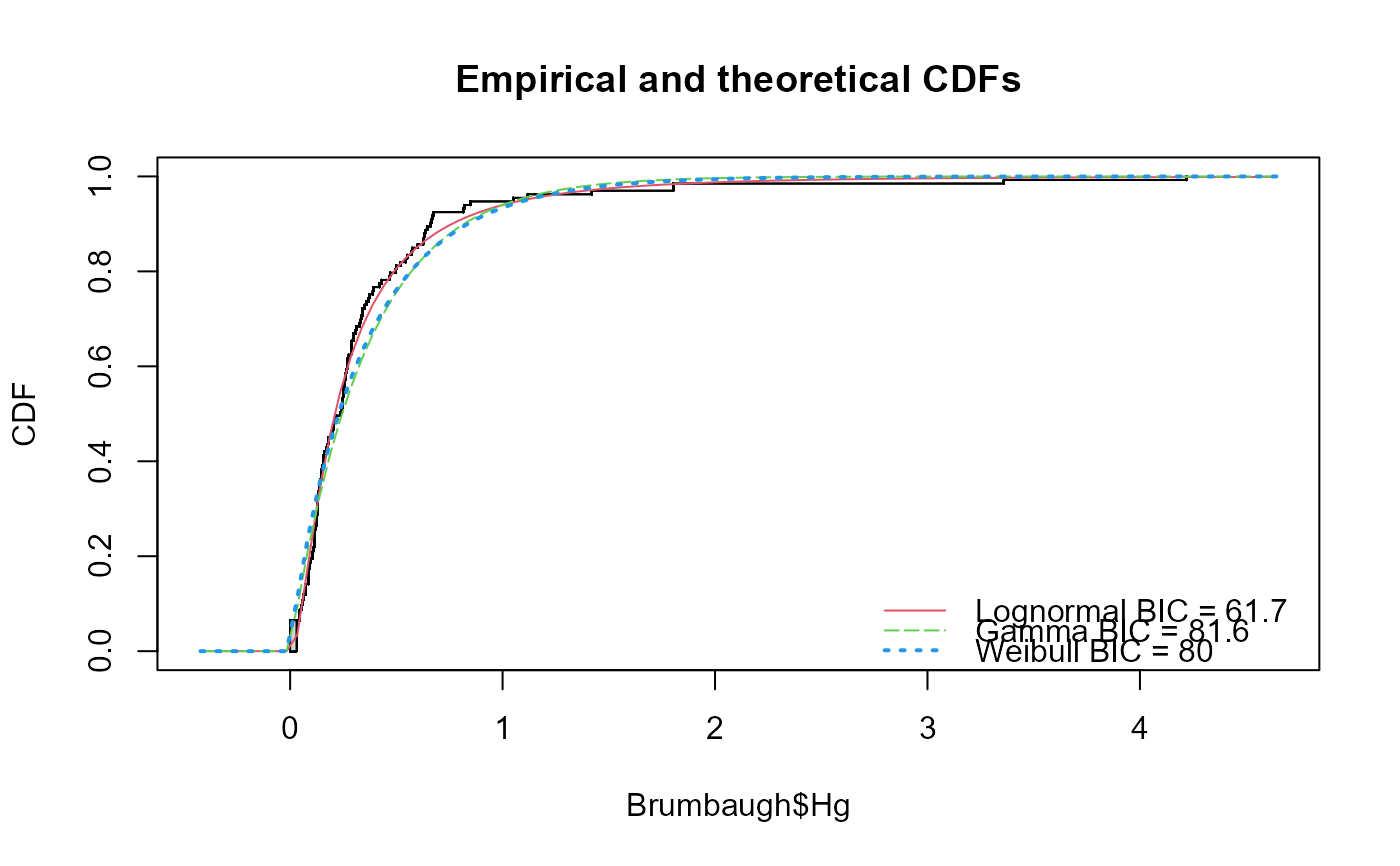
 # With Weibull distribution
cenCompareCdfs(Brumbaugh$Hg,Brumbaugh$HgCen,dist3="weibull")
# With Weibull distribution
cenCompareCdfs(Brumbaugh$Hg,Brumbaugh$HgCen,dist3="weibull")
 # Using an distribution not supported by this function (yet)
# you will get an error message
if (FALSE) cenCompareCdfs(Brumbaugh$Hg,Brumbaugh$HgCen,dist3="beta")
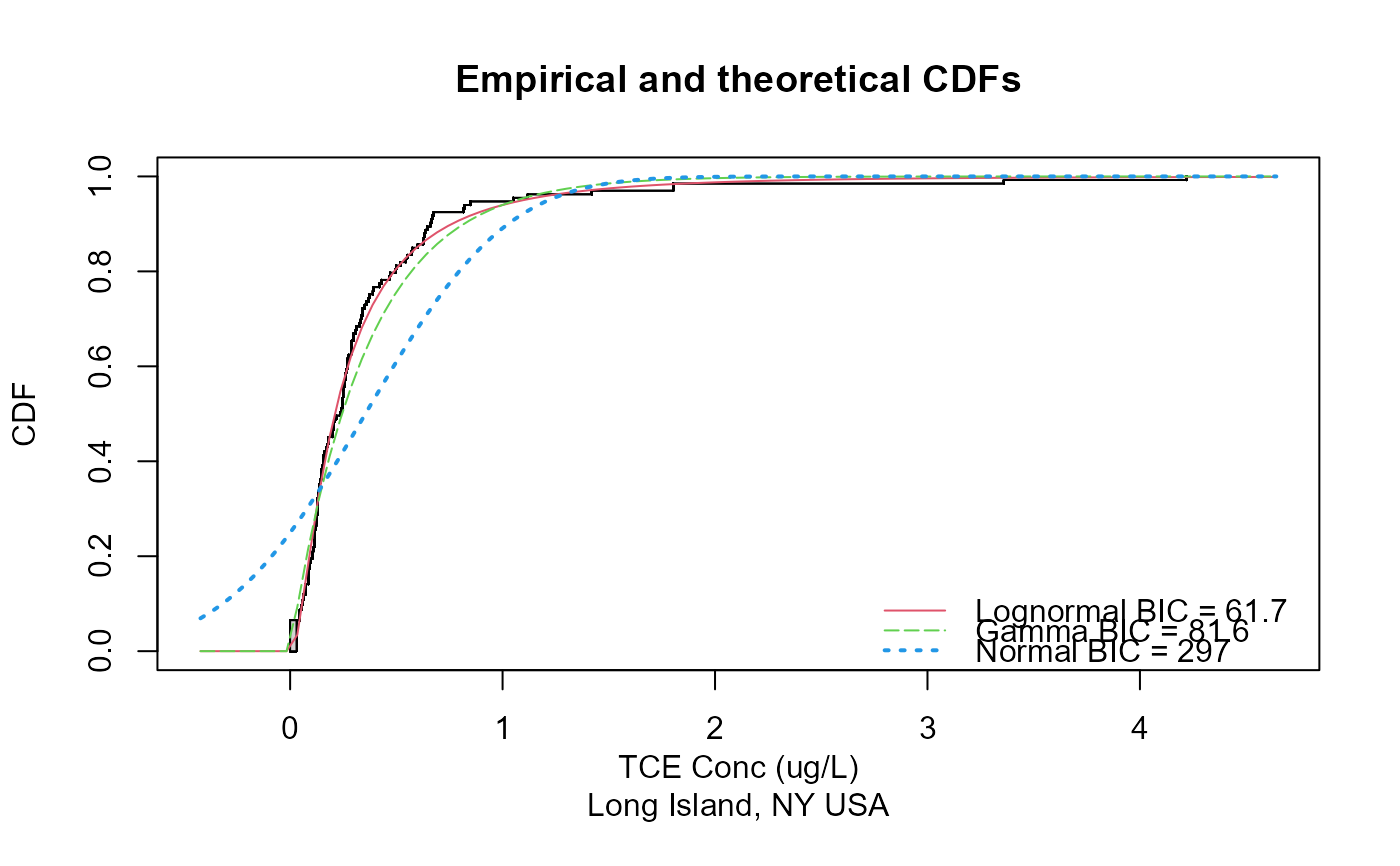
# With Yname specified
cenCompareCdfs(Brumbaugh$Hg,Brumbaugh$HgCen,Yname="TCE Conc (ug/L)\nLong Island, NY USA")
# Using an distribution not supported by this function (yet)
# you will get an error message
if (FALSE) cenCompareCdfs(Brumbaugh$Hg,Brumbaugh$HgCen,dist3="beta")
# With Yname specified
cenCompareCdfs(Brumbaugh$Hg,Brumbaugh$HgCen,Yname="TCE Conc (ug/L)\nLong Island, NY USA")