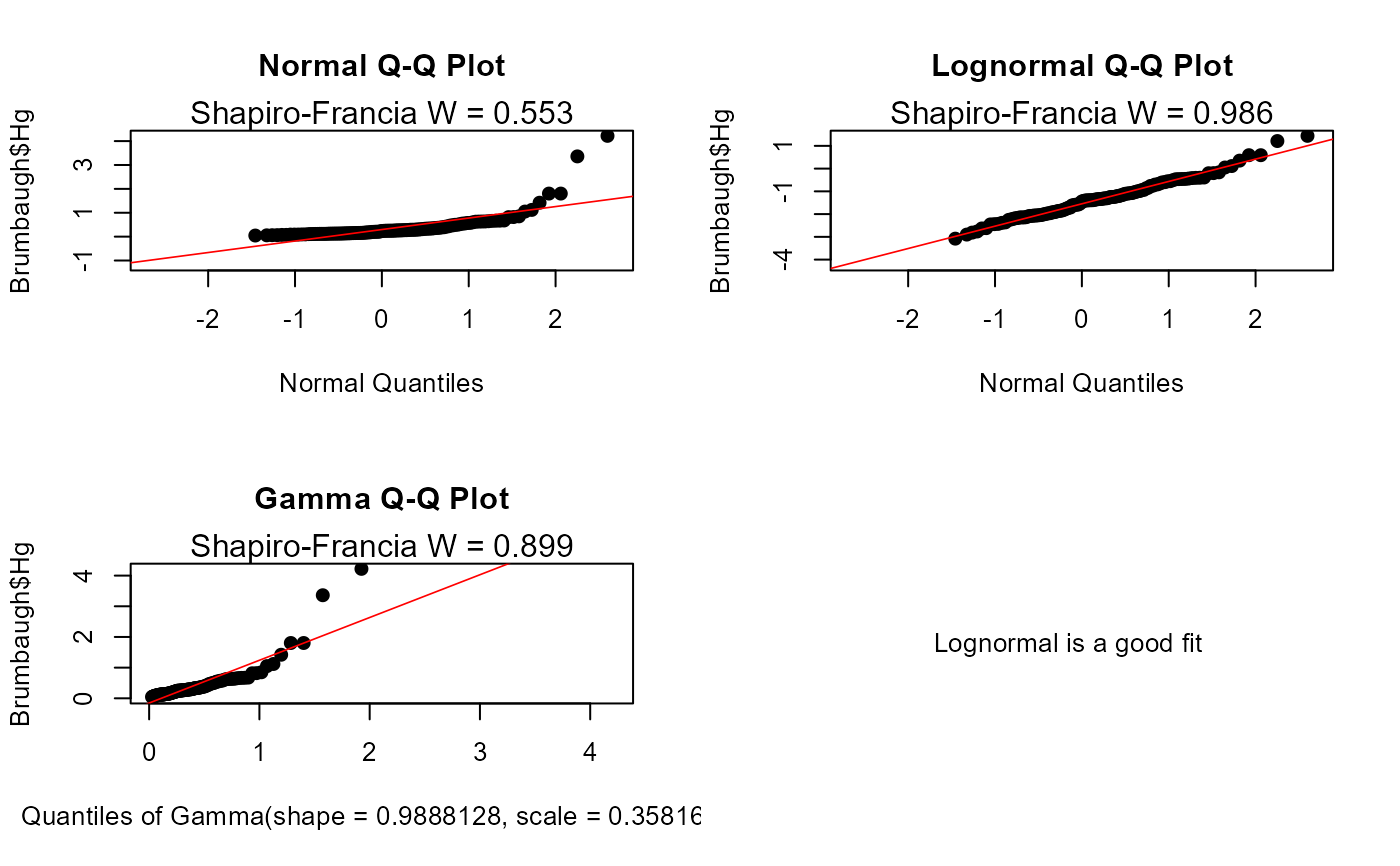
Produces three quantile-quantile (Q-Q) plots, also called probability plots, based on three distributions (normal, lognormal and gamma distributions).
cenCompareQQ(x.var, cens.var, Yname = yname, printrslt = TRUE, ...)Arguments
- x.var
The column of x (response variable) values plus detection limits
- cens.var
The column of indicators, where 1 (or
TRUE) indicates a detection limit in they.varcolumn, and 0 (orFALSE) indicates a detected value iny.var.- Yname
Optional – input text in quotes to be used as the variable name on all plots. The default
Ynameis the name of they.varinput variable.- printrslt
Logical
TRUE/FALSEoption of whether to print the best distribution in the console window, or not. Default isTRUE.- ...
further graphical parameters (from par), such as srt, family and xpd.
Value
Plots three Q-Q plots based on normal, lognormal and gamma distributions and prints the best-fit distribution.
Details
Produces three Q-Q plots and reports which one has the highest Shapiro-Francia test statistic (W). The distribution with the highest W is the best fit of the three.
References
Helsel, D.R., 2011. Statistics for censored environmental data using Minitab and R, 2nd ed. John Wiley & Sons, USA, N.J.
Millard, S.P., 2013. EnvStats: An R Package for Environmental Statistics. Springer-Verlag, New York.
Shapiro, S.S., Francia, R.S., 1972. An approximate analysis of variance test for normality. Journal of the American Statistical Association 67, 215–216.
Examples
data(Brumbaugh)
cenCompareQQ(Brumbaugh$Hg,Brumbaugh$HgCen)
#> Lognormal is a good fit