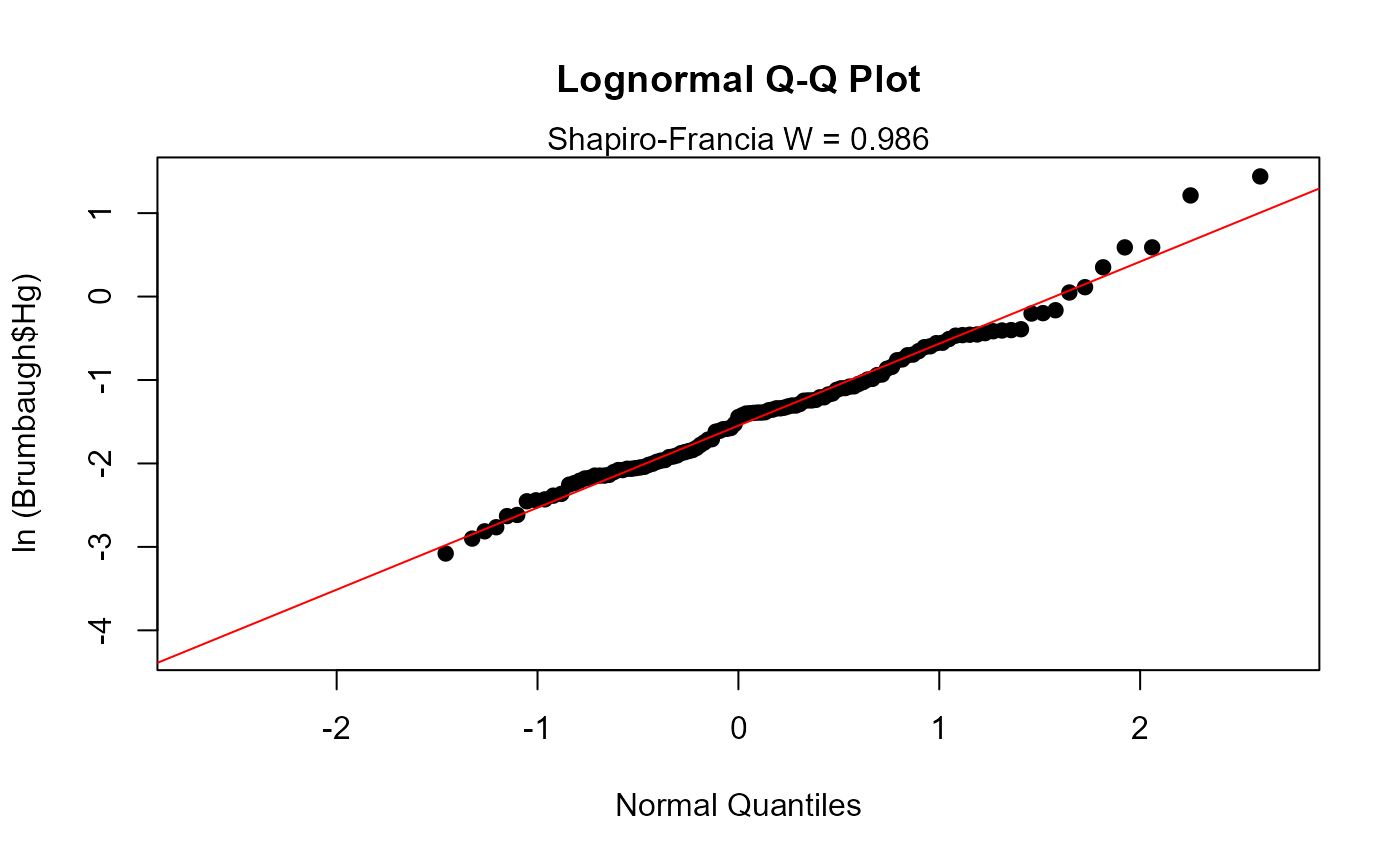
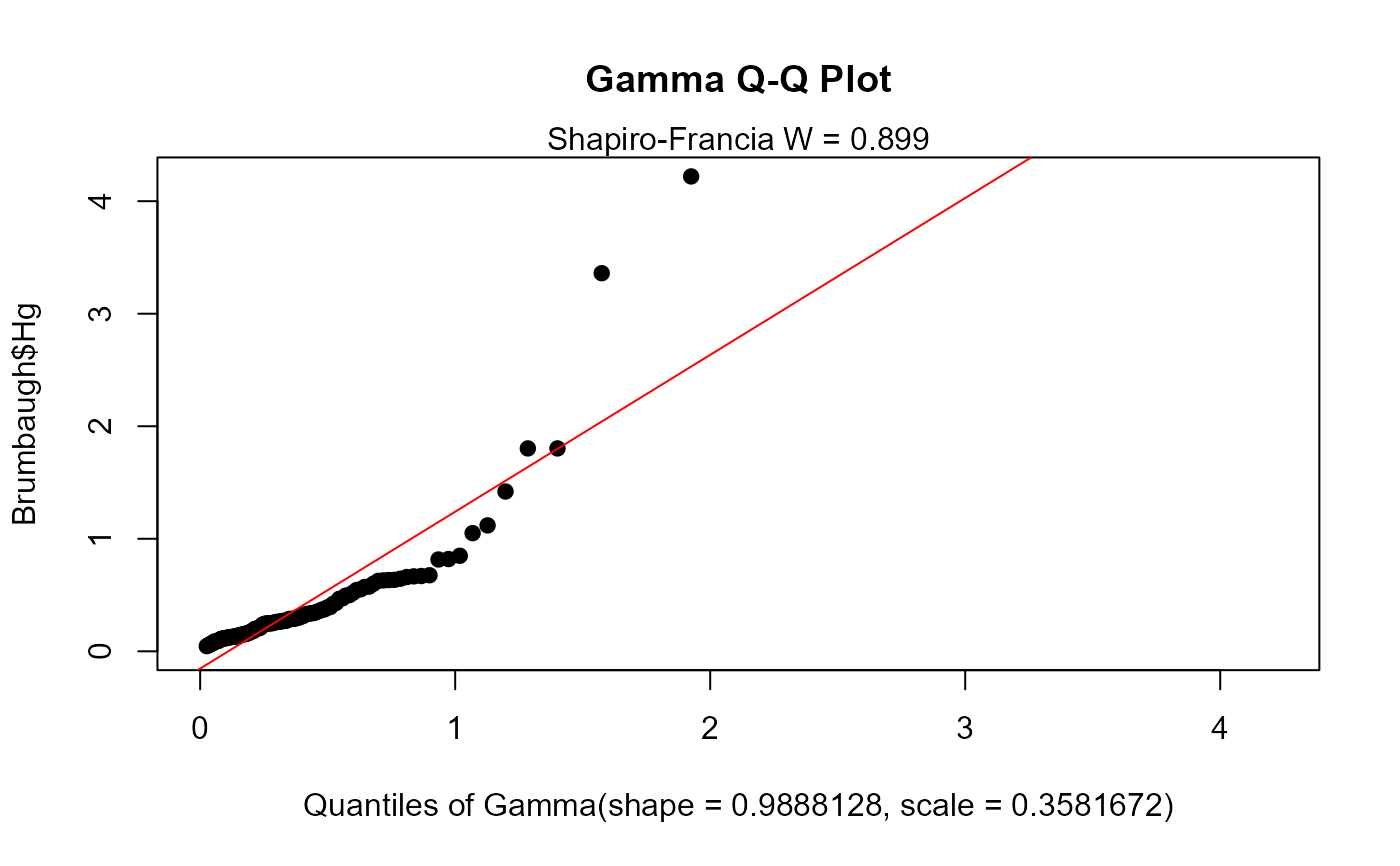
Plots a quantile-quantile (Q-Q) plot of censored data versus a fitted data distribution
cenQQ(x.var, cens.var, dist = "lnorm", Yname = yname)Arguments
- x.var
The column of
x(response variable) values plus detection limits- cens.var
The column of indicators, where 1 (or
TRUE) indicates a detection limit in they.varcolumn, and 0 (orFALSE) indicates a detected value iny.var.- dist
One of three distributional shapes to fit to your data: lognormal (
lnorm), normal (norm) or gamma (gamma).- Yname
Optional – input text in quotes to be used as the variable name on the Q-Q plot. The default is the
Ynamename of they.varinput variable.
Value
A single Q-Q plot of data fitted by normal, lognormal or gamma distributions with Shapiro-Francia W value printed on plot.
References
Helsel, D.R., 2011. Statistics for Censored Environmental Data using Minitab and R, 2nd ed. John Wiley & Sons, USA, N.J.
Shapiro, S.S., Francia, R.S., 1972. An approximate analysis of variance test for normality. Journal of the American Statistical Association 67, 215–216.
Examples
# \donttest{
data(Brumbaugh)
cenQQ(Brumbaugh$Hg,Brumbaugh$HgCen)
 # User defined distribution
cenQQ(Brumbaugh$Hg,Brumbaugh$HgCen,dist="gamma")
# User defined distribution
cenQQ(Brumbaugh$Hg,Brumbaugh$HgCen,dist="gamma")
 # }
# }