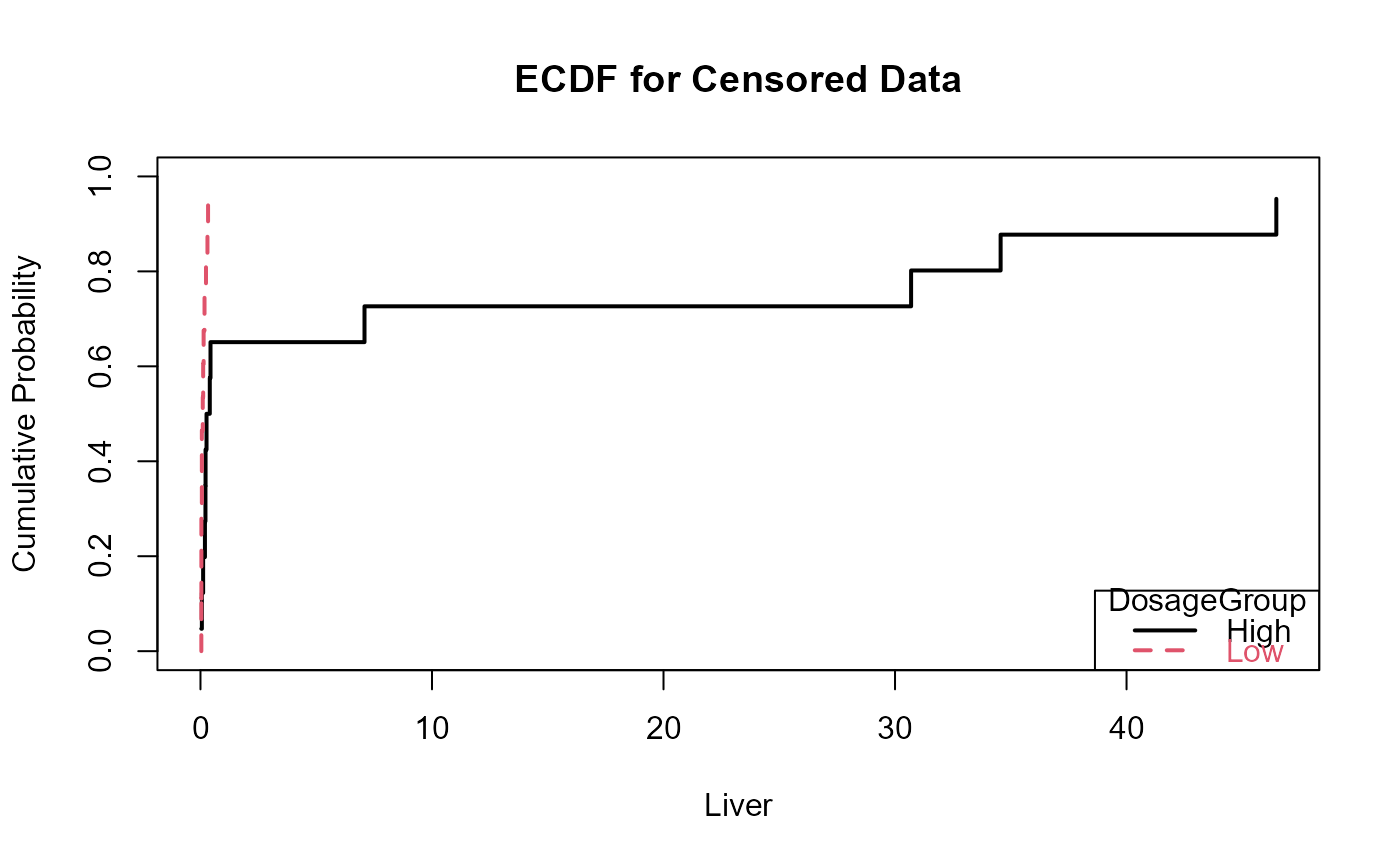
Plots ecdfs of one or more groups of censored data. Illustrates the differences between groups for group tests such as those done using cen1way or cenanova.
Arguments
- x.var
The column of data values plus detection limits
- cens.var
The column of indicators, where 1 (or
TRUE) indicates a detection limit in they.varcolumn, and 0 (orFALSE) indicates a detected value iny.var.- xgroup
Optional - grouping or factor variable. Can be either a text or numeric value indicating the group assignment.
- xlim
Limits for the x (data) axis of the ecdf plot. Default is 0 to the maximum of the y.var variable. To change, use option xlim = c(0, 50) if 50 is to be the maximum on the plot.
- Ylab
Optional – input text in quotes to be used as the variable name on the ecdf plot. The default is the name of the
y.varinput variable.
Value
Plots an empirical cumulative distribution function. If group=NULL the ECDF of the entire dataset is produced. If group is identified then ECDFs are plotted for each group seperately and a legend added.
References
Helsel, D.R., 2011. Statistics for Censored Environmental Data using Minitab and R, 2nd ed. John Wiley & Sons, USA, N.J. Millard, S.P., 2013. EnvStats: An R Package for Environmental Statistics. Springer-Verlag, New York.