Performs a parametric test of whether the mean difference between two columns of paired censored data equals 0. Assumes that the paired differences follow a gaussian (normal) distribution.
cen_paired(xd, xc, yd, yc, alternative = "two.sided", printstat = TRUE)Arguments
- xd
The first column of data values plus detection limits
- xc
The column of censoring indicators, where 1 (or
TRUE) indicates a detection limit in the xd column, and 0 (orFALSE) indicates a detected value in xd.- yd
The second column of data values plus detection limits, or a single number representing a standard / guideline value.
- yc
The column of censoring indicators for yd, where 1 (or
TRUE) indicates a detection limit in the yd column, and 0 (orFALSE) indicates a detected value inyd. Not needed ifydis a single standard number.- alternative
The usual notation for the alternate hypothesis. Default is
“two.sided”. Options are“greater”or“less”.- printstat
Logical
TRUE/FALSEoption of whether to print the resulting statistics in the console window, or not. Default isTRUE.
Value
A list of statistics containing the following components:
nNumber of observationsZThe value of the test statisticp.valuethe p-value of the testMean differencethe mean difference betweenxdandyd
Details
You may also test for whether the mean of the xd data exceeds a standard by entering the single number for the standard as yd. In that case no yc is required.
References
Helsel, D.R., 2011. Statistics for Censored Environmental Data using Minitab and R, 2nd ed. John Wiley & Sons, USA, N.J.
See also
Examples
data(atrazine)
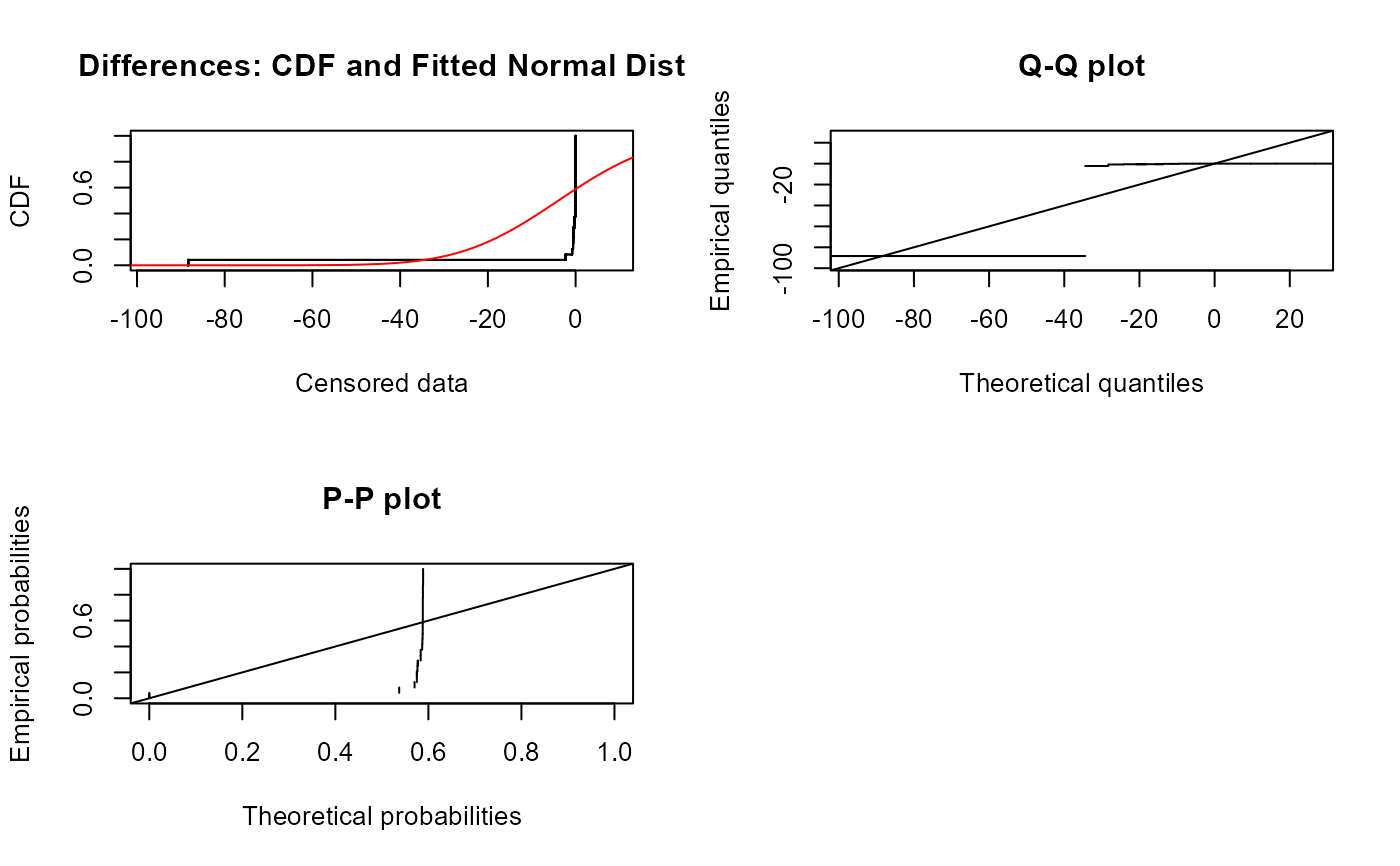
cen_paired(atrazine$June,atrazine$JuneCen,atrazine$Sept,atrazine$SeptCen)
#> Censored paired test for mean(atrazine$June - atrazine$Sept) equals 0.
#> alternative hypothesis: true mean difference does not equal 0.
#>
#> n = 24 Z= -1.0924 p-value = 0.2747
#> Mean difference = -3.927
 # Comparing standard/guieline value
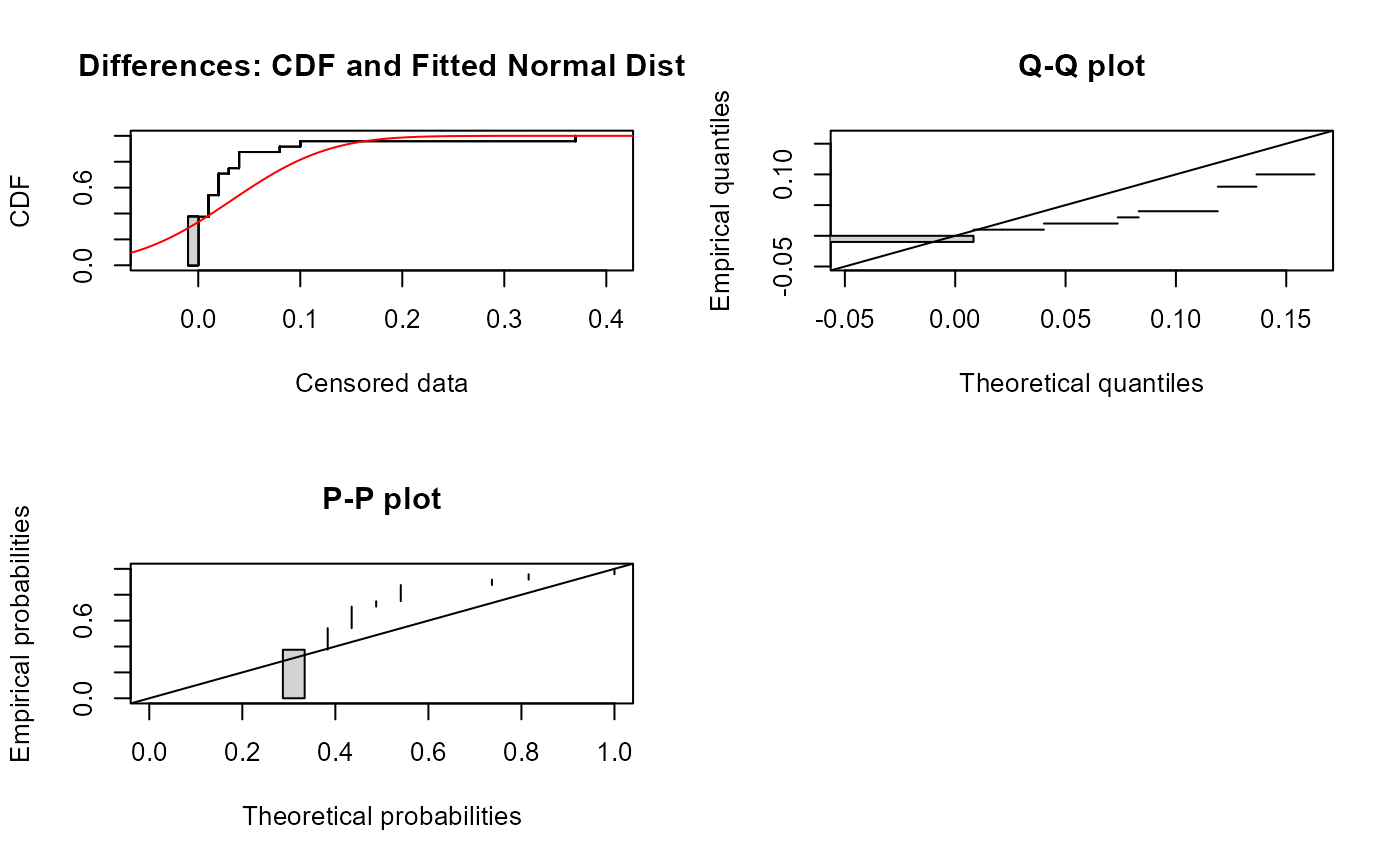
cen_paired(atrazine$June, atrazine$JuneCen, 0.01, alternative = "greater")
#> Censored paired test for mean(atrazine$June) equals 0.01
#> alternative hypothesis: true mean atrazine$June exceeds 0.01.
#>
#> n = 24 Z= 2.1004 p-value = 0.01785
#> Mean atrazine$June = 0.04231
# Comparing standard/guieline value
cen_paired(atrazine$June, atrazine$JuneCen, 0.01, alternative = "greater")
#> Censored paired test for mean(atrazine$June) equals 0.01
#> alternative hypothesis: true mean atrazine$June exceeds 0.01.
#>
#> n = 24 Z= 2.1004 p-value = 0.01785
#> Mean atrazine$June = 0.04231