Computes the ATS (Mann-Kendall trend test for censored data) after adjustment of censored data for a covariate.
centrend(
  y.var,
  y.cens,
  x.var,
  time.var,
  link = "identity",
  Smooth = "cs",
  printstat = TRUE,
  stackplots = FALSE,
  drawplot = TRUE
)
Arguments
- y.var
The column of y (response variable) values plus detection limits
- y.cens
The column of indicators, where 1 (or
TRUE) indicates a detectionlimit in they.varcolumn, and 0 (orFALSE) indicates a detected value iny.var.- x.var
Column of a covariate (not time).
y.varwill be smoothed versusx.varand residuals taken to subtract out the relationship betweenyandx.- time.var
Column of the time variable, either a sequence of days or decimal times, etc. Will be the scale used for time in ATS trend analysis.
- link
Default =
“identity”which means it uses data in the original units. See details.- Smooth
Type of smoother used in the GAM. Default is
“cs”, shrinkage cubic regression splines. See details for other options.- printstat
Logical
TRUE/FALSEoption of whether to print the resulting statistics in the console window, or not. Default isTRUE.- stackplots
logical
TRUE/FALSEoption to stack three plots that are output onto the same page instead of each on separate page. Default is 'FALSE', each separate.- drawplot
Logical
TRUE/FALSEoption of whether to draw plots or not. Default isTRUE
Value
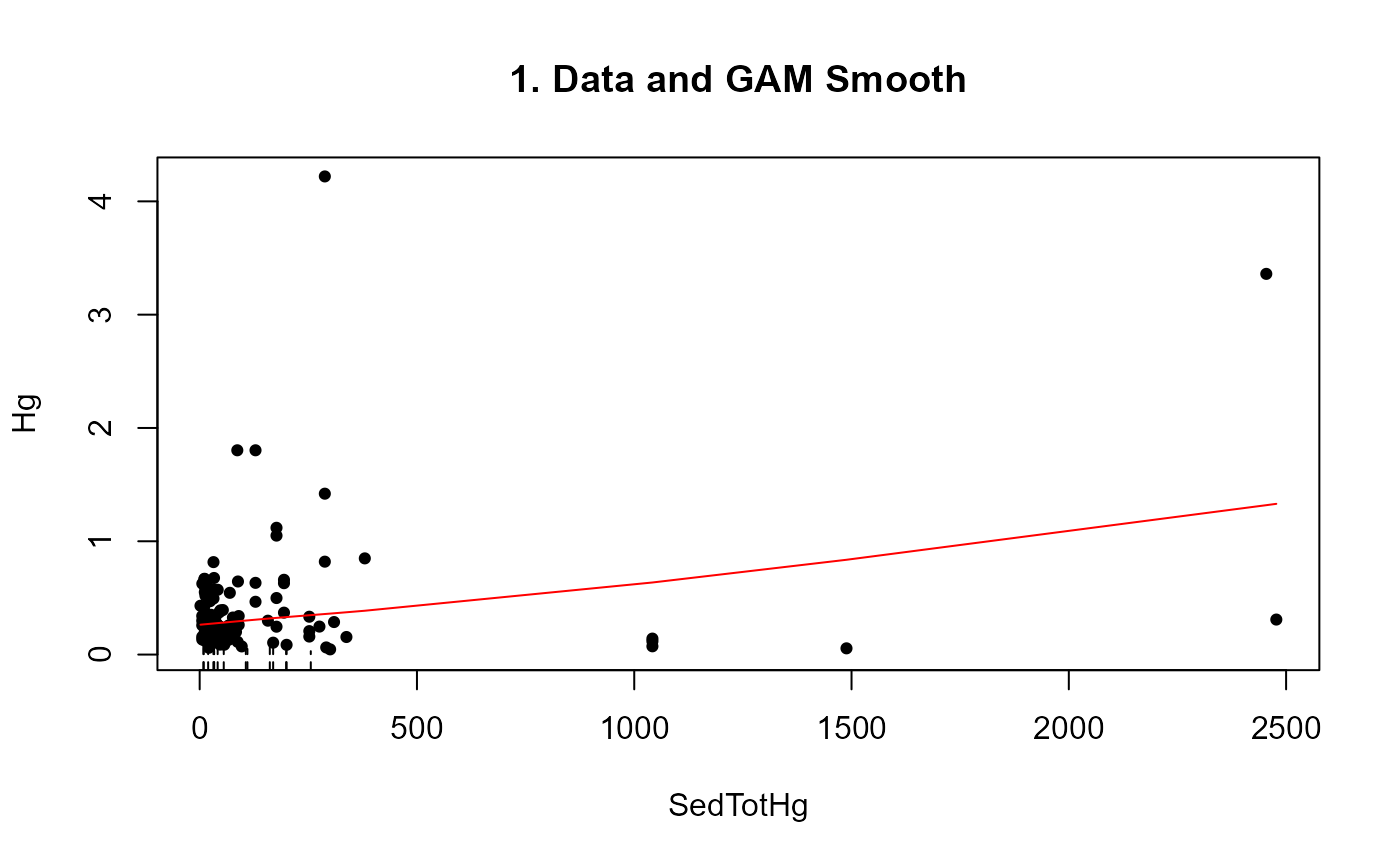
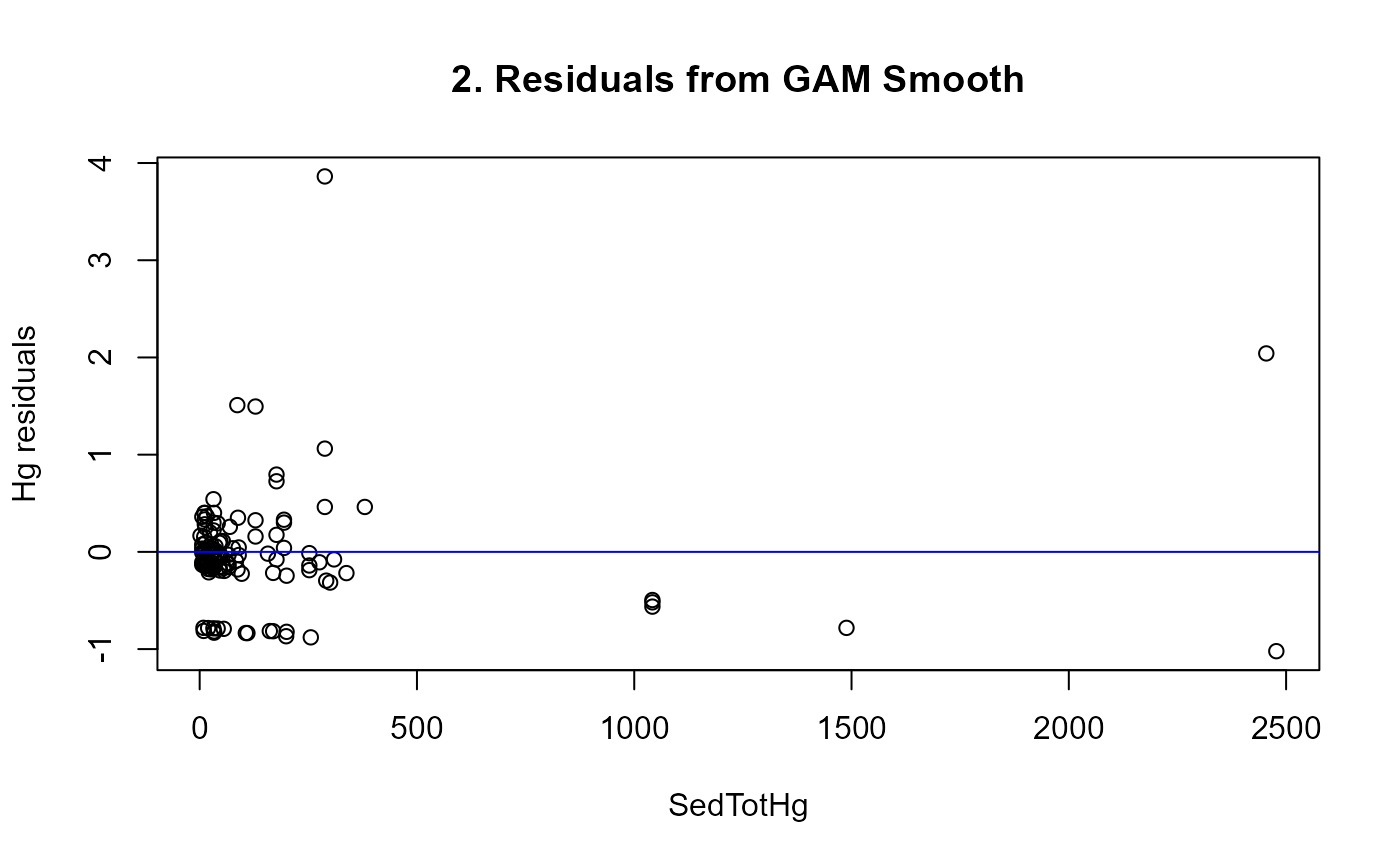
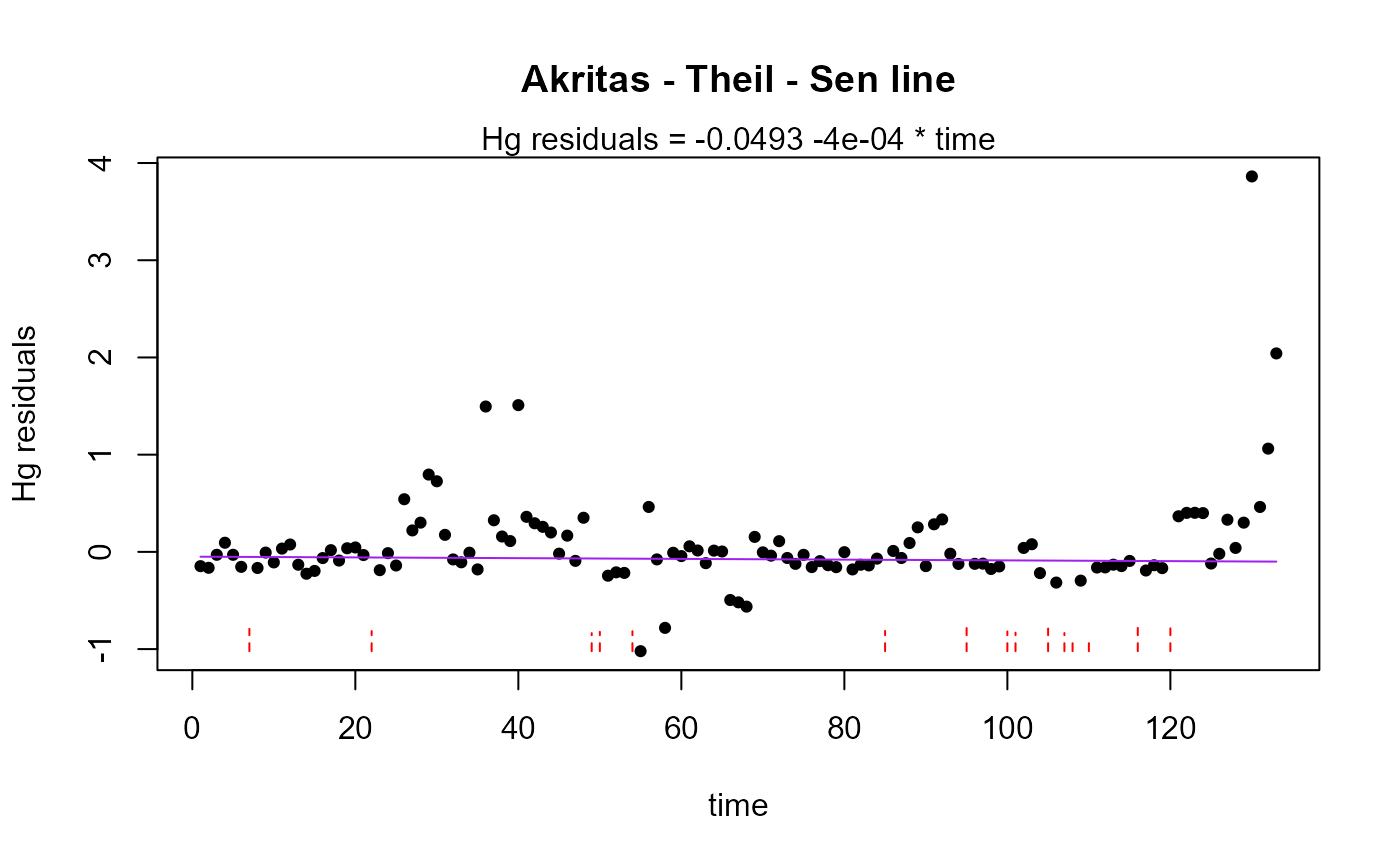
Prints three plots: Y data vs time with GAM Smooth, Residuals from GAM Smooth vs time, and ATS trend line of residuals vs time.
Returns GAM residuals and ATS results on trend test of residuals (intercept, slope, Kendall's tau, p-value for trend)
Details
Default link = identity. The y variables are then used in their original units. Other options are available see cenGAM::tobit1 for more options.
Default Smooth is "cs" for shrinkage cubic regression splines. See mgcv::smooth.terms for other types of smoothing algorithms. '"ts"' is a thin-plate regression spline and is also commonly used.
References
Helsel, D.R., 2011. Statistics for censored environmental data using Minitab and R, 2nd ed. John Wiley & Sons, USA, N.J.
See also
Examples
data(Brumbaugh)

Brumbaugh$time=1:nrow(Brumbaugh)

with(Brumbaugh,centrend(Hg,HgCen,SedTotHg,time.var=time,drawplot=TRUE))


#> Trend analysis of Hg adjusted for SedTotHg
#> Akritas-Theil-Sen line for censored data
#>
#> Hg residuals = -0.0493 -4e-04 * time
#> Kendall's tau = -0.036   p-value = 0.53998
#>
