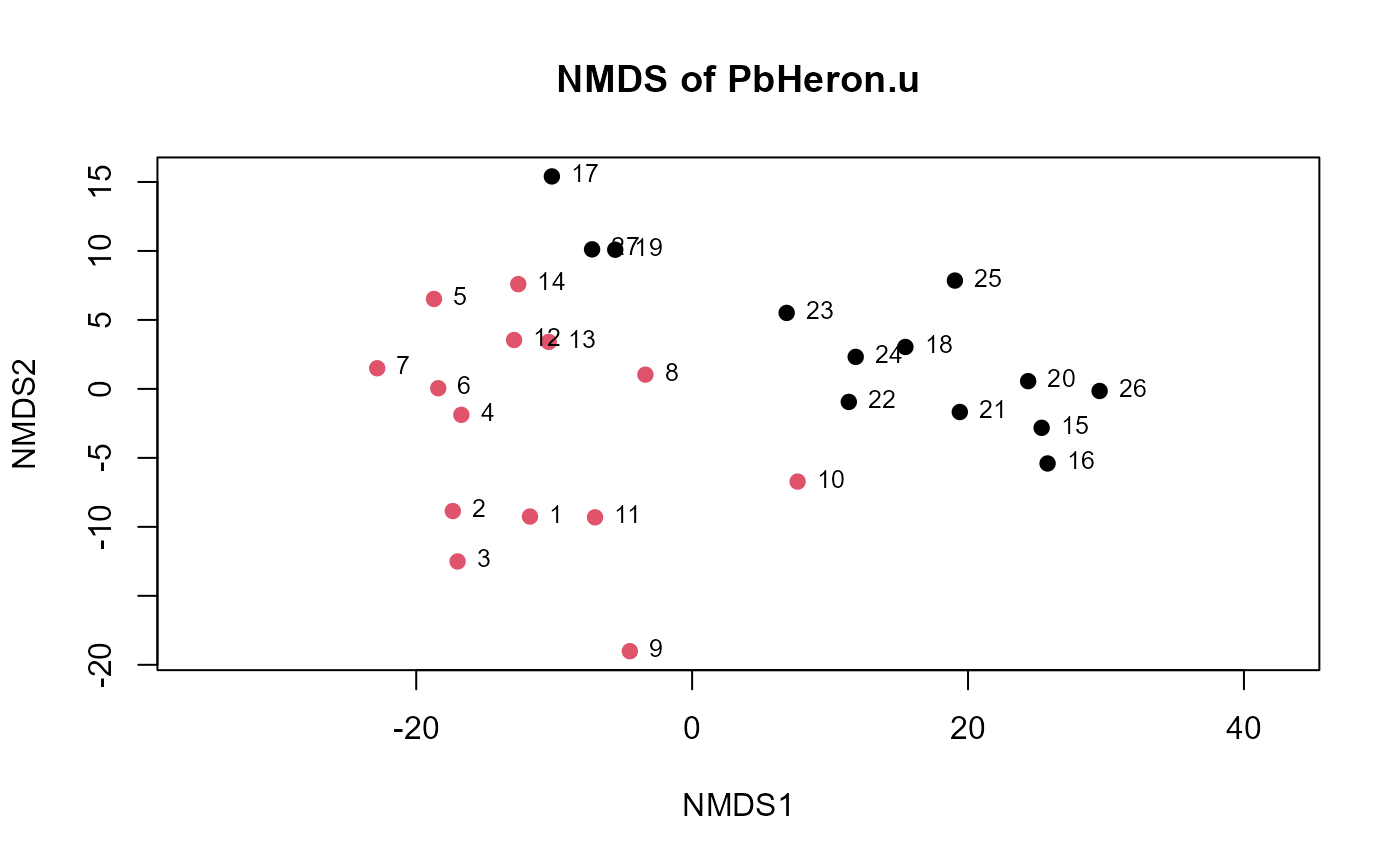
Plots an NMDS of uscores output from the uscores or uscoresi functions.
uMDS(uscor, group = NULL, title = NULL, legend.pos = "bottomleft")Arguments
- uscor
A data frame of uscores or ranks of uscores produced by either the
uscores(...)oruscoresi(...)functions- group
Optional grouping variable. Sites will be represented by different colored symbols for each group.
- title
Optional title for the NMDS graph.
- legend.pos
For when group is specified, the location of the legend on the graph showing the colors representing each group’s data. Default is “bottomleft”. Alternatives are “topright” and “centerleft”, etc.
Value
Prints an NMDS plot of censored data groupings based on U-scores #' @references Helsel, D.R., 2011. Statistics for Censored Environmental Data using Minitab and R, 2nd ed. John Wiley & Sons, USA, N.J.
Examples
data(PbHeron)

PbHeron.u <- uscores(PbHeron[,4:15])
uMDS(PbHeron.u)
#> Run 0 stress 0.07773434
#> Run 1 stress 0.0866076
#> Run 2 stress 0.1336005
#> Run 3 stress 0.0866076
#> Run 4 stress 0.07762542
#> ... New best solution
#> ... Procrustes: rmse 0.009282691  max resid 0.03814353
#> Run 5 stress 0.07851582
#> Run 6 stress 0.07851582
#> Run 7 stress 0.1323279
#> Run 8 stress 0.07844726
#> Run 9 stress 0.07851582
#> Run 10 stress 0.07844726
#> Run 11 stress 0.07851582
#> Run 12 stress 0.1367695
#> Run 13 stress 0.0866076
#> Run 14 stress 0.07851582
#> Run 15 stress 0.07793355
#> ... Procrustes: rmse 0.01225892  max resid 0.03832617
#> Run 16 stress 0.07762542
#> ... Procrustes: rmse 4.66175e-06  max resid 1.437959e-05
#> ... Similar to previous best
#> Run 17 stress 0.08639937
#> Run 18 stress 0.07851582
#> Run 19 stress 0.1389213
#> Run 20 stress 0.0866076
#> *** Best solution repeated 1 times
#> species scores not available


# With group specific
uMDS(PbHeron.u,group=PbHeron$DosageGroup)
#> Run 0 stress 0.07773434
#> Run 1 stress 0.1294192
#> Run 2 stress 0.1390066
#> Run 3 stress 0.07844726
#> Run 4 stress 0.08660761
#> Run 5 stress 0.07793355
#> ... Procrustes: rmse 0.007560968  max resid 0.0287086
#> Run 6 stress 0.07851582
#> Run 7 stress 0.07844726
#> Run 8 stress 0.1294192
#> Run 9 stress 0.07844726
#> Run 10 stress 0.07844726
#> Run 11 stress 0.07851582
#> Run 12 stress 0.1302991
#> Run 13 stress 0.07793356
#> ... Procrustes: rmse 0.007569939  max resid 0.0287771
#> Run 14 stress 0.08660763
#> Run 15 stress 0.07851582
#> Run 16 stress 0.07844726
#> Run 17 stress 0.07844726
#> Run 18 stress 0.07851582
#> Run 19 stress 0.07844726
#> Run 20 stress 0.07773434
#> ... Procrustes: rmse 3.798017e-06  max resid 1.572314e-05
#> ... Similar to previous best
#> *** Best solution repeated 1 times
# With group specific
uMDS(PbHeron.u,group=PbHeron$DosageGroup)
#> Run 0 stress 0.07773434
#> Run 1 stress 0.1294192
#> Run 2 stress 0.1390066
#> Run 3 stress 0.07844726
#> Run 4 stress 0.08660761
#> Run 5 stress 0.07793355
#> ... Procrustes: rmse 0.007560968 max resid 0.0287086
#> Run 6 stress 0.07851582
#> Run 7 stress 0.07844726
#> Run 8 stress 0.1294192
#> Run 9 stress 0.07844726
#> Run 10 stress 0.07844726
#> Run 11 stress 0.07851582
#> Run 12 stress 0.1302991
#> Run 13 stress 0.07793356
#> ... Procrustes: rmse 0.007569939 max resid 0.0287771
#> Run 14 stress 0.08660763
#> Run 15 stress 0.07851582
#> Run 16 stress 0.07844726
#> Run 17 stress 0.07844726
#> Run 18 stress 0.07851582
#> Run 19 stress 0.07844726
#> Run 20 stress 0.07773434
#> ... Procrustes: rmse 3.798017e-06 max resid 1.572314e-05
#> ... Similar to previous best
#> *** Best solution repeated 1 times